BDSwiss App
Download & start trading

 Yesterday, on May 8, 2024, Toyota Motor Corporation (TMC) unveiled its financial results for the fiscal year ending March 31, 2024. With an EPS of $4.67 and revenue reaching $71.16 billion, the figures exceeded analysts’ forecasts.

As of May 2024, Toyota holds a market capitalisation of $312.18 billion, ranking itself as the 30th most valuable company globally by market cap, according to data from companiesmarketcap.com.
Toyota Motor Corporation ( NYSE: TM ) Dividend Information 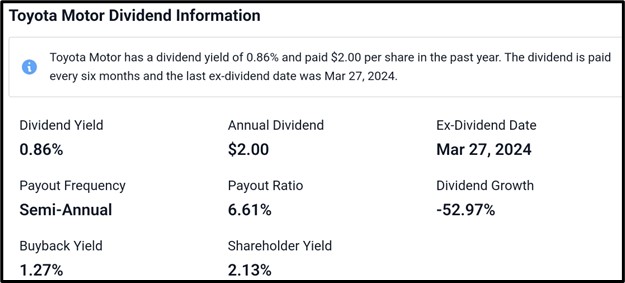
Toyota Motor Corporation boasts a dividend yield of 0.86%, having paid out $2.00 per share over the past year. This dividend is distributed biannually, with the last ex-dividend date recorded on March 27, 2024. The payout ratio stands at 6.61%, with a dividend growth rate of -52.97%. Additionally, the buyback yield is 1.27%, contributing to a shareholder yield of 2.13%.
Recent Development At Toyota  Incorporating multimedia and digital innovation, the 2024 Mirai integrates Toyota’s advanced Smart Connect+ multimedia system, accessible through a redesigned 12.3-inch touchscreen interface. This system grants users access to cloud-based navigation, continually refreshed with real-time traffic data, facilitating optimised journey planning.
FY2024 Recap ( (April 1, 2023 through March 31, 2024) 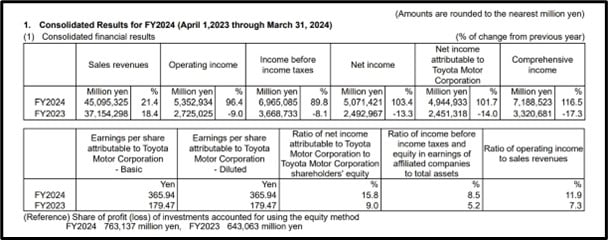
In fiscal year 2024, Toyota Motor Corporation achieved sales revenues of 45,095,325 JPY, marking a growth of 21.4%. Operating income reached 5,352,934 JPY, reflecting a substantial increase of 96.4%. Income before income taxes amounted to 6,965,085 JPY, representing a rise of 89.8%, while net income stood at 5,071,421 JPY, indicating a growth of 103.4%. Net income attributable to Toyota Motor Corporation reached 4,944,933 JPY, showing an increase of 101.7%. Comprehensive income amounted to 7,188,523 JPY, demonstrating a surge of 116.5%. The earnings per share attributable to Toyota Motor Corporation, both basic and diluted, were 365.94 JPY. The net income ratio attributable to Toyota Motor Corporation to Toyota Motor Corporation shareholders’ equity stood at 15.8%. Additionally, the income ratio before income taxes and equity in earnings of affiliated companies to total assets was 8.5%, while the ratio of operating income to sales revenues was 11.9%.
Technical Analysis 
From a technical analysis perspective utilising the Daily chart of ( NYSE: TM ) from TradingView, it’s evident that the price has been in a downtrend since March 26, 2024. A downtrend line, initiated from $255.14, rebuffed the price at $248.87 after a retracement from $237.79. Following the rejection, the downward trajectory persisted, leading to a current support level of $222.23. Despite a retracement to $235.35, where the downtrend line again acted as resistance, the price currently hovers around $231.78. Should the rejection by the downtrend line remain intact, there’s a high likelihood of the price declining to the support level. Conversely, if the support is breached, further downside movement is probable. However, if the rejection by the downtrend line fails and the price breaches above it, there’s a high probability of an upward continuation.
Conclusion
In essence, Toyota Motor Corporation’s 2024 fiscal year performance highlights its resilience and growth trajectory, surpassing analysts’ expectations with robust financial results. Coupled with innovative product developments like the 2024 Mirai, Toyota continues to demonstrate its commitment to driving technological advancements and delivering value to its shareholders and customers alike.
Sources:
https://global.toyota/en/newsroom/corporate/40759288.html
https://companiesmarketcap.com/toyota/marketcap/
https://stockanalysis.com/stocks/tm/dividend/
https://www.hotcars.com/toyota-world-leading-automotive-company/
 Da-Costa Assumang
Posted on 17 May, 2024 at 15:02 GMT
Posted on 16 May, 2024 at 13:08 GMT
Posted on 15 May, 2024 at 13:16 GMT
Posted on 14 May, 2024 at 11:41 GMT
Posted on 09 May, 2024 at 12:16 GMT


